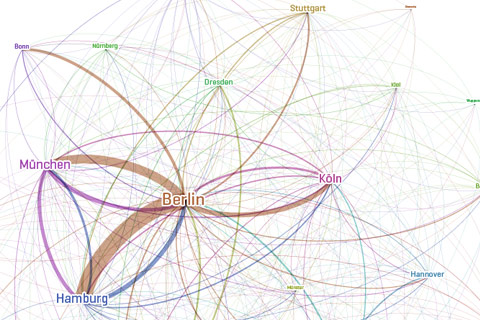
Where people move in Germany
A quick diversion based on Bing search results for the phrase “von X nach Y gezogen” (“moved from X to Y”) applied to the top 30 German cities.
Made with Gephi and pattern.py
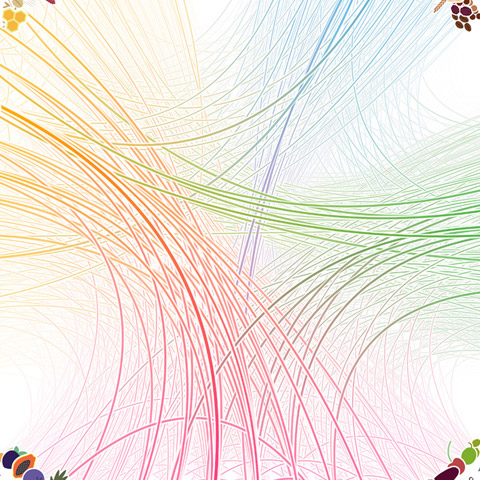
Muesli Ingredient Network
I put a little new project online, analyzing which ingredients were ordered together most often in custom muesli mixtures from mymuesli.com customers. Besides chocolate, nuts and oat, the project description also features a little excursion on matrix views of networks, and conditional probabilities.
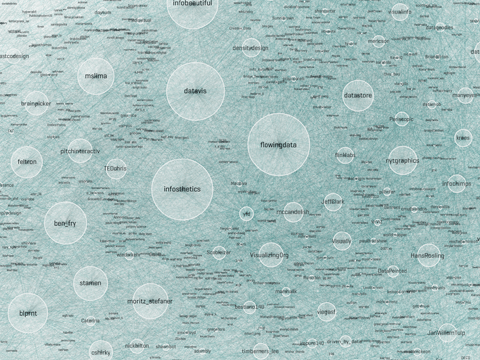
The VIZoSPHERE
A new diversion of mine: mapping twitter accounts related to information visualization with gephi:
This map shows 1645 twitter accounts related to the topic of information visualization. The accounts were determined as follows: For a subjective selection of “seed accounts”[1], the twitter API was queried for followers and friends. In order to be included into the map, a user account needed to have at least 5 links (i.e. follow or being followed) to one of these accounts. The size of the network nodes indicates the number of followers within this network.
[1] The seed accounts were; @moritz_stefaner, @datavis, @infosthetics, @wiederkehr, @FILWD,
@janwillemtulp, @visualisingdata, @jcukier, @mccandelish, @flowingdata, @mslima, @blprnt,
@pitchinteractiv, @bestiario140, @eagereyes, @feltron, @stamen, @thewhyaxis
well-formed.eigenfactor
Finally, the results of a cooperation with the guys from eigenfactor are online!
For the impatient: here’s the direct link: http://well-formed.eigenfactor.org
The site features 4 different visualizations, trying different approaches to mapping information flow and citation structure in the sciences.


