Dr. vis.
I am currently using my baby-time-off-my-university-job to get my options sorted out for further research. The MACE project is running for another year, so the big decision is, if+how to pursue a PhD. At my home base FHP, formally, I cannot do a PhD. So, at least, I have to find a good Ph.D. supervisor at a “real” university.
For this purpose, I started to map all institutions and people that could be candidates or helpful or interesting to meet on Google maps.

I am not 100% clear about both the mode and the scope of the thesis. But I think it is safe to say I would love to advance design research in visualization of the social web.
If you – prosumer you are – have any additional ideas of who I could get in touch with, or could even imagine supervising my thesis, I would be very happy about additional spots on the map or a little comment here. Thanks!
The form of facts and figures

Congratulations to Christian for another yummy Master’s thesis from FH Potsdam: The Form of Facts and Figures. He collected, organized and commented on a variety of information design and visualization patterns.

I do hope he will put a pdf online!
See#3

More visualization videos! The See#3 conference organized by Scholz&Volkmer took place in Wiesbaden this weekend, and luckily the streams are online. The speaker list includes Dr. Fritz Reusswig, Frank van Ham, Ben Fry, Julien de Smedt, Zachary Lieberman + Bruce Sterling.
Visualizing a hierarchical glossary

For the EU project MACE, I have been experimenting with hierarchical visualizations.
Just the quick link for now, I hope I find the time to share some of the background and findings later…
On a related note: 9 days left to hand in your papers and take part in a great conference this autumn!

Flare
Finally, a decent Flash framework for Information Visualization is available: Flare is an offspring of the Java-based prefuse toolkit, written in ActionScript 3. Especially notable is the good support for animated transitions, an important topic in interactive visualization. Flare is open source software licensed under the terms of the BSD license, and can be freely used for both commercial and non-commercial purposes.
Thanks to Till for the tip!
Visualization and Aesthetics Research
Just a quick pointer to three interesting papers about the trends in and models of information visualization:
Andrea Lau and Andrew Vande Moere
Towards a Model of Information Aesthetics in Information Visualization
This paper proposes a model of information aesthetics in the context of information visualization. It addresses the need to acknowledge a recently emerging number of visualization projects that combine information visualization techniques with principles of creative design. The proposed model contributes to a better understanding of information aesthetics as a potentially independent research field within visualization that specifically focuses on the experience of aesthetics, dataset interpretation and interaction. The proposed model is based on analysing existing visualization techniques by their interpretative intent and data mapping inspiration. It reveals information aesthetics as the conceptual link between information visualization and visualization art, and includes the fields of social and ambient visualization. This model is unique in its focus on aesthetics as the artistic influence on the technical implementation and intended purpose of a visualization technique, rather than subjective aesthetic judgments of the visualization outcome. This research provides a framework for understanding aesthetics in visualization, and allows for new design guidelines and reviewing criteria.
While I find the triangle model based on Data, Interaction and Aesthetics quite enlightening and useful, I am not so convinced of the data focus and mapping focus classification. Anyways a great paper.
Robert Kosara
Visualization Criticism – The Missing Link Between Information Visualization and Art
Interesting points, especially the claim that we need to think about frameworks to criticize information visualization examples and techniques from different perspectives. The presented model, however, is quite simplistic, focussing on readability and recognizability, and based on that, a one–dimensional and —from my perspective—too shallow distinction of pragmatic vs. artistic approaches.
Fernanda B. Viégas and Martin Wattenberg
Artistic Data Visualization: Beyond Visual Analytics
A nice overview of not strictly analytic approaches to information visualization.
You say… We say…
Another visual experiment on tagging:
How do individuals use tags — compared to the community? Do you use private language or are you a mainstream tagger? When you tag with “design” — do the others think it is “art”?
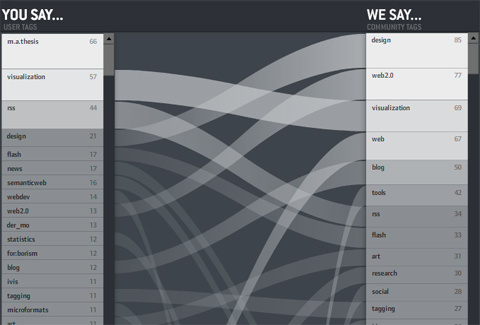
On the left: the personal tags for the personal bookmarks — ordered by frequency — the containing box per is log-scaled so you get an impression of the long–tail position of a tag. Which means: Often used tags are large, bright and go to the top.
On the right: community tags for the tagged ressources.
In the middle: tags with the same name are connected. If a line is horizontal, the indvidual and the community essentially agree on the relevance of the tag for the ressources. The steeper it is — the larger the disagreement. If no line starts at a tag, it means it is not present in the other list
So in the picture above, you can see my tags. Same facts you can read from the picture:
• “m.a.thesis” is a very often used, but private tag of mine.
• The ressources I tag in general are mostly tagged with “design” by the community. I, however, use the tag “design” much less often.
• “news”, “semantic web”, “webdev” are tags I use often, but not the community.
etc.
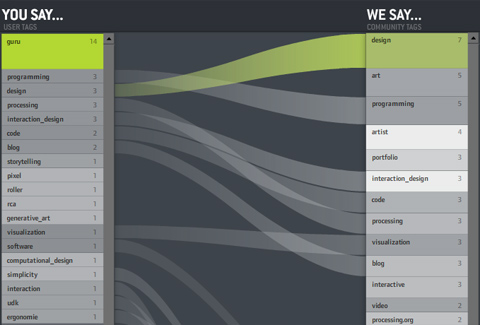
And often course, you can click individual tags to see what the comparison is like for subsets of the bookmarks. That’s especially interesting for obscure tags like “guru” — you can see what the tagger “means” by looking at the distribution of the community bookmarks (in this case “design – art – programmer – artist”). Interesting!
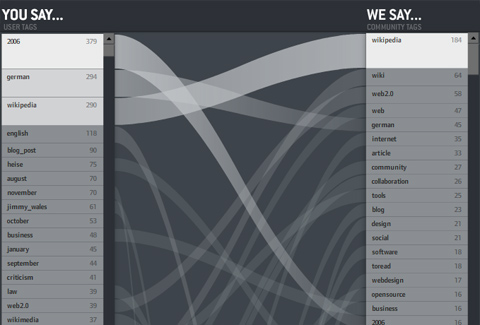
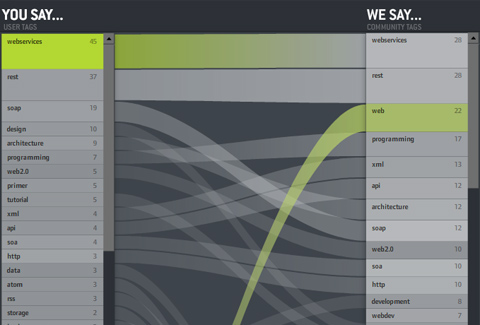
Some more shots:
I wish I could say “click here for the interactive version” as usual — but unfortunately, del.icio.us offers a JSON API, but did not put a crossdomain.xml file on their server. Which means the visualization (which runs nicely on my harddisc) cannot load data when put in the web. Bummer. I hope I can figure something out.
So for now — I can only offer a download link. Click the index.html. You might have to adjust you Flash player security settings in order to load the community tags. Caveat: The application is still a bit buggy and pretty heavy concerning processor ressources.
Hans Rosling / gapminder
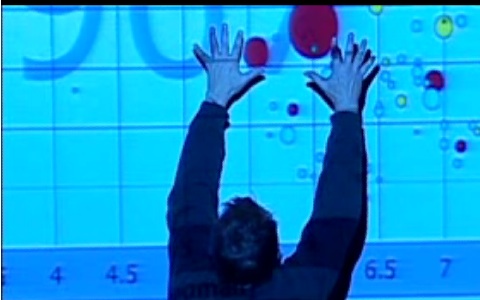
Watch Myths about the developing world, a talk by Hans Rosling from gapminder.org
Intense, thrilling, passionate. 10/10.