eyeo community visualizations
The eyeo festival and the community around it has a very special place in my heart. When Dave Schroeder announced the team was editing a book to celebrate the fifth anniversary, my immediate thought was to use this opportunity to follow up on an old idea, which I had been kicking around for a while (also with a few friends) — mapping the community around this arts-tech-creative-code-datavis thing.
What are the different niches in the community? Who is bridging the clusters? How do places, institutions, shape these communities, how do people influence each other over time? End of the day, I’d really like to have this big map of how the last 20 years went down in the field.
So, I took the chance and asked each eyeo contributor (speaker, panelist, lecturer…) from the past five years to name their most important connections in three categories:

resulting in the eyeo scenegraph network visualization:
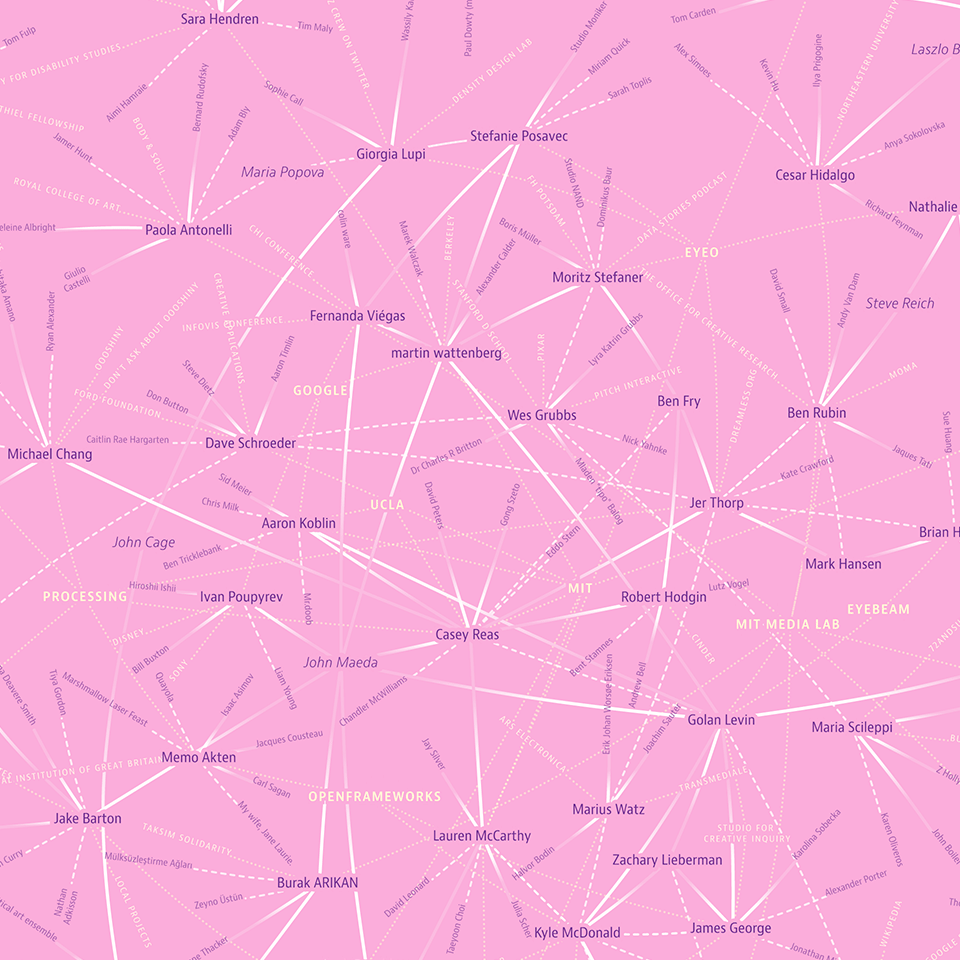
This map is much less about the big topology and importance of individual nodes, but much more about all the individual connections and anecdotes. You really need to take some time to study all the links and references.
Most interesting to me — the list of people who were mentioned by at least two others, but never spoke themselves at the festival (or, at least, din’t answer the survey): Nicole Aptekar, Mike Migurski, Laszlo Barabasi, Maria Popova, Steve Reich, John Cage, Aurelia Moser, Alexander Galloway, Daito Manabe (spoke in 2013), Jesper Kouthoofd, Michael Naimark, Sep Kamvar, John Maeda.
The workflow for this one was quite complex – a python script to collect the data (took days, as the new twitter API allows only very limited access), layout calculations in gephi, svg export for manual tweaks in Illustrator.
But, it left me (and Golan Levin, who dropped by at my house one day :D) a bit unsatisfied: where are all the other people… Just focussing on the people on stage seemed inadequate for eyeo, where the visitors are sometimes more interesting than the speakers :D
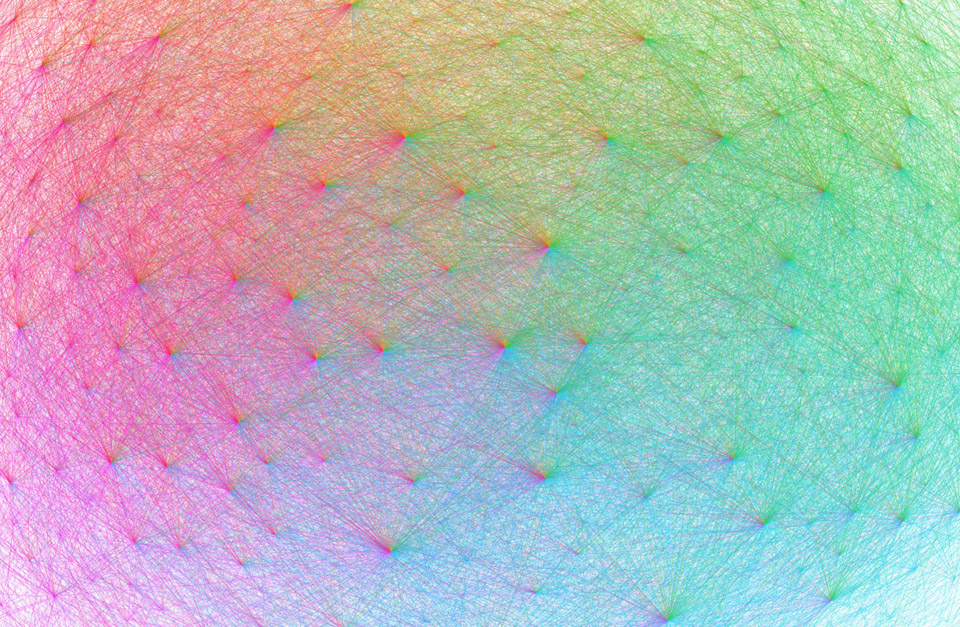
Luckily, the eyeo team collected twitter handles from attendees! So I went on and created the eyeo crowdcloud:
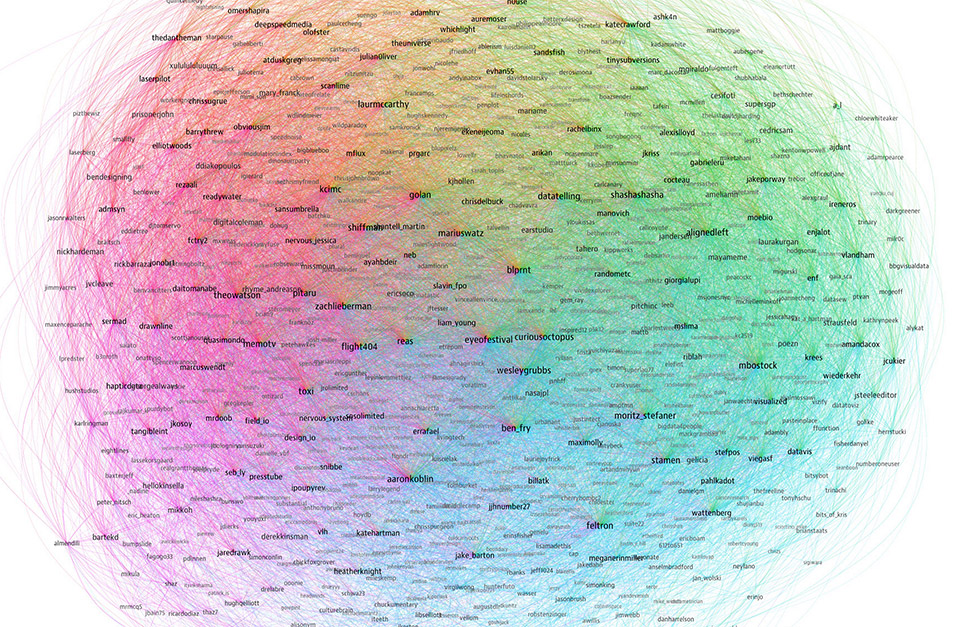
A network map, showing 852 twitter accounts related to the eyeo festival. The network layout was calculated using gephi and brings more strongly connected accounts closer together. The size of the account labels corresponds to the number of followers in this network. Each line drawn is a followership relation. It is colored according to the followers color which is assigned based on the angular position on the map. As a result, accounts with followers from many different regions of the map look more colorful.
This one is much more dense and interesting from a “landscape” point of view — the different sub communities are represented quite well on different areas in the map, with colorful connectors in the center :)
Obvious “see also”: The resonet visualization I did for resonate.
And, here’s the best part — the visuals actually made it to the book — as cover and chapter visuals!
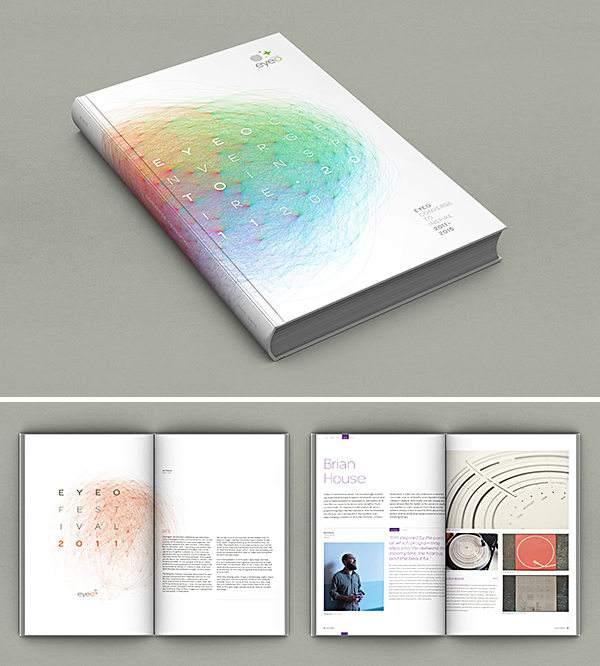
I am super grateful to Dave Schroeder and the team for this huge honor, and enabling me to give back to a festival that has been so important for me!
Now, my only drop of bitterness is that I’ll miss the festival next week… but there’s only so-and-so much travel I (and the family) can enjoy. I’ll be following on twitter! ;)
VIS 2014
I long, long resisted going to IEEE VIS, but this year, it’s about time. I’ll moderate a panel featuring top notch speakers: Tariq, Scott, Matteo, Greg and I will try to shed some light on what it’s like to work with and publish data in the NGO context, and how we can improve! This should be interesting. Check out the (simple) announcement video here:
The other thing I am really looking forward to, is the tutorial I’ll teach together with Dominikus Baur. We will look at all the practical aspects of producing successful web-based data visualizations — except the actual data vis code. So, we will discuss deeplinking, performance, shareability, help and explanations, fallbacks, mobile optimizations – all the stuff that makes great web applications really great, but which we all underestimate all the time.
Looking forward! Who else is going? Ping me!
PS: Maybe we should do a datastories listener meetup? Or something?
Lasst die Daten sprechen
Here is the recording of my (German) talk from last year’s decoded conference: “Lasst die Daten sprechen – Datenvisualisierung und Informationsaesthetik”
Speaking at eyeo

The eyeo festival is going to take place end of June in Minneapolis, and boy, does it have a line-up: Ben Fry, Zach Lieberman, Aaron Koblin, Mark Hansen, Robert Hodgin, Nervous System, Marius Watz, Amanda Cox, Nicholas Felton, Golan Levin, Greg Smith and many other great speakers – it reads like the “who is who” of contemporary code+design culture.
Imagine how I was rubbing my eyes when I was asked to speak there too! I am much looking forward to what will surely be a very unique event and I hope many of you can make it there, so we can hang out and talk shop. Tickets are quite limited, so make sure to decide quickly!
see #5

In its five years of existence, the see conference managed to bring quite a few of the most exciting speakers from design, art, architecture and new technologies on stage to talk about their perspective on information visualization.
This year’s conference takes place on April 17, 2010 at the Kulturzentrum Schlachthof Wiesbaden (Germany) and features the following line-up:
- Gideon Obarzanek, the founder of Chunky Move, an Australian dance company known for “genre-defying dance performance”
- Joshua Prince-Ramus, President of REX, a cutting-edge architecture firm
- Nicholas Felton (feltron.com), a New York based information designer, co-founder of daytum.com and probably best known for his personal annual reports
- Hannes Koch from rAndom International, a London-based art and design collective
- Kent Demaine from OOOii, who design future interfaces for Hollywood and, among others, brought us the visionary interface design for Minority Report
- and amystery keynote speaker. (I love mysteries!)
Some tickets are still left, but not terribly many, so better register sooner than later. For those of you who cannot make it, there will be a live video stream of the event, and archived video recordings later. The recorded talks of the past conferences are well worth a visit too, with speakers ranging from Casey Reas over Carsten Nicolai to Stamen’s Eric Rodenbeck, Ben Fry, Zachary Lieberman and many more.
DaVis’10: Design and Aesthetics in Visualization

Everybody complains that art, design and research in information visualization should be talking more to each other.
Here is a unique opportunity: Andrew Vande Moere and I will be hosting a symposium at IV10: DAVis, the 5th International Symposium on Design and Aesthetics in Visualisation.
From the call:
“This symposium aims to bring together researchers and practitioners of design, art and related disciplines. The goal is to share their stories and experiences on how the needs and goals of both users and businesses are met through information visualisation.
It supports the publication of research in two general domains: Design and Aesthetics. Design refers to the development of visualisation as a creative design process. Aesthetics refers to the role of user experience in visualisation, as understood in three distinct components: aesthetic experience, experience of meaning, and emotional experience.
This symposium presents an opportunity to explore these issues and their consequences for the field of information visualization. In particular, we encourage the submission of design critiques; case studies, possibly with accompanying evaluation studies or critical reflections; position papers; or reports on the impact that visualization research or visualization use has had on the work and life of people. In this context, the story of failures or abandoned approaches can be as informative as descriptions of success. The fields of application are open, and can reach from traditional screen-based graphs, over innovative multi-touch interfaces, to dynamic media architecture displays.”
So – designers, coders, artists, visualizers – go forth and write!
Update: make sure to check out the submission requirements and procedure up at the IV main page.
Beware: the deadline is tight: March 1. March 21 But honestly, you would not have started earlier, anyways – right? Feel free to get in touch if you have any questions, and we are really looking forward to your submissions.
Information aesthetics showcase @ siggraph
The well-formed.eigenfactor project will be at display at the Information Aesthetics Showcase, curated by Victoria Szabo, at SIGGRAPH 2009, August 3–7 in New Orleans. I will also give a little Monday morning talk on the project and am really excited to be part of this first intrusion of the information aesthetics scene into the conference on computer graphics!
Talks, talks, talks
Some of my upcoming events:
FIND08 workshop
Sept. 03, Torino
I am just preparing a presentation on the Content Landscape application I designed for SVA BizSphere based on my elastic lists. It is quite a massive Flex application for browsing and analysing thousands of resources. Details to come.
Biennale
Sept. 09, Venice
Watch out, we’ll show something beautiful. Details to come.
MACE conference
Sept. 20-21, Venice
The MACE project project goes in its final year – time to get connected!
VizThink 08
Oct. 13-14, Berlin
I am proud to be one of the facilitators (~workshop leaders) at the VizThink Conference. I haven’t decided on a topic yet, but it might well be related to visualization(oho!) and the semantic web. I am really looking forward to this event, sounds like a great format and the facilitator list is quite impressive already.
Xtopia
Nov. 17,18, Berlin
I will give an introductory talk about visualization and information design at Microsoft’s Xtopia Conference for “Business, Web Technology, Design & UX”.
Busy times huh – let me know if you attend one of these events and want to meet up!
Blast from the past

Hey, I didn’t notice: The Innovationsforum Interaktionsdesign videos are online.
Great talks from one year ago – find my old comments here.
ECTEL 08
The ECTEL 08 webpage is online. I take credit for the clean design and the animal theme – maybe a bit unexpected for a technology enhanced learning conference, but I found it fit the motto quite well.
Thanks to Marco Kalz and Marcus Specht for the great cooperation, and especially for recommending drupal.