Elastic times

Today was a good day, so I thought I would share its results immediately, instead of fine-tuning forever – who knows when I find the time anyways!
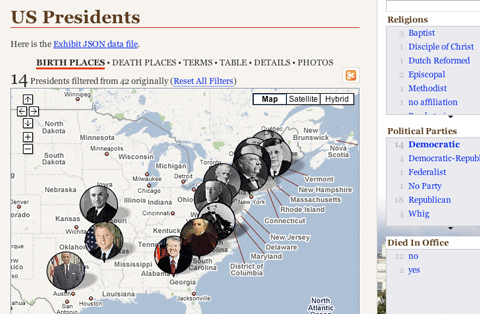
I built a little facet browser for the New York Times Article Search API – an impressively fast faceted search engine covering over two million articles. So, give it a spin!
Some caveats:
- Don’t look for the page navigation – there is none. Pure laziness, will update it soon.
- The initial counts are based on a search for “the” (which I figured would appear in all articles). Unfortunately, only the top 15 or so values per facet are returned, so you cannot click, e.g. the year 2008 in the beginning. Will fix.
- The API has a request limit of 5000 queries per day. So if your requests don’t work – come back tomorrow morning :)
- Unfortunately, the API seems to support only one value per facet. So, all facets are single-select.(fixed, see comments).
The code is based on my totally revamped elastic lists prototype. I used this project as a little sandbox experiment of how easy customization is possible, and especially how to make a switch from a fully client-based to a server–based filtering model.
Exhibit
Elastic lists
Just a short post, but another demo is online.
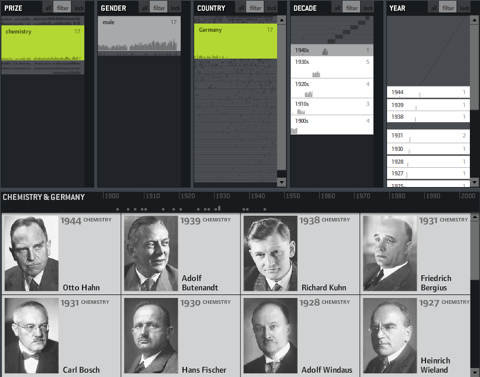
It is a demonstration of the “elastic list” principle for browsing multi-facetted data structures. Click any number of list entries to query the database for a combination of the selected attributes. If you create an “impossible” configuration, your selection will be reduced until a match is possible.
The example data is based on the Noble prize winners dataset used in the Flamenco facet browser.
Elastic lists enhance traditional facet browsing approaches by
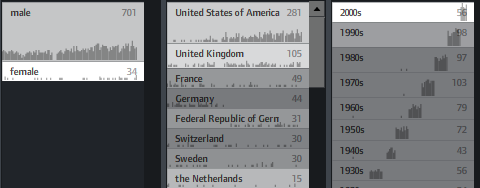
• visualizing relative proportions (weights) of metadata values by size
• visualizing unusualness of a metadata weight by brightness
• and animated filtering transitions.
In unfiltered view, the brightness shows a trend measure, indicating a rising number of prices of the last years.
In filtered views, a brighter background indicates a higher weight of the metadata value compared to the overall distribution.

If, for instance, you click “peace” as in the example above, you will see that “female” and “Switzerland” are much brighter, indicating that the proportion of women and Swiss is much higher in this context than compared to the whole data set. That’s interesting information and could also be used to characterize the result set of a keyword query or any other collection in terms of its “characteristic” metadata values. Besides that, it fosters understanding of how metadata values are correlated with each other, which is often interesting information itself.
You can also switch on little sparklines to see the temporal distribution of each metadata value: