Visualizing randomness

Just came across an interesting diploma thesis by Daniel A. Becker, supervised by Prof. Johannes Bergerhausen:
WHAT DOES RANDOMNESS LOOK LIKE?
RANDOM WALK asks this question and presents experiments in mathematics and physics, showing the mysterious interaction of chaos and order in randomness.
The project RANDOM WALK simulates randomness in visualizations, which are easy to understand. In this way, it delivers insight into a phenomenon, which has so far remained unexplained.
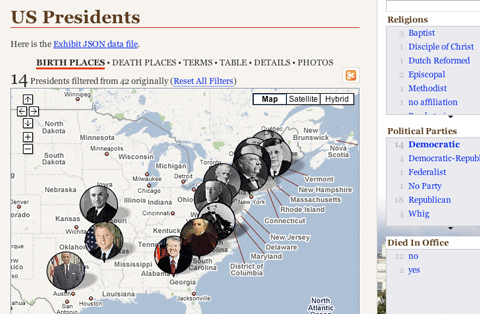
Election visualization roundup
With the US presidential elections coming up tomorrow (exciting!), here is a little roundup of related visualizations and information graphics I enjoyed:
→ read more
Running the numbers
Seeing Chris Jordan‘s TED talk (embedded below) just made me remember his great work in visualizing large numbers of things going wrong.
About his latest project, Running the numbers, he writes:
Running the Numbers looks at contemporary American culture through the austere lens of statistics. Each image portrays a specific quantity of something: fifteen million sheets of office paper (five minutes of paper use); 106,000 aluminum cans (thirty seconds of can consumption) and so on. My hope is that images representing these quantities might have a different effect than the raw numbers alone, such as we find daily in articles and books. Statistics can feel abstract and anesthetizing, making it difficult to connect with and make meaning of 3.6 million SUV sales in one year, for example, or 2.3 million Americans in prison, or 32,000 breast augmentation surgeries in the U.S. every month.
This project visually examines these vast and bizarre measures of our society, in large intricately detailed prints assembled from thousands of smaller photographs. Employing themes such as the near versus the far, and the one versus the many, I hope to raise some questions about the role of the individual in a society that is increasingly enormous, incomprehensible, and overwhelming.
Parallax

David Huynh has recently joined the freebase team, after having worked on Exhibit and other SIMILE tools at MIT. His new project Parallax is obviously based on Exhibit (which followed mostly a faceted filtering paradigm) but demonstrates a really interesting “sidewards browsing technique” for navigating related sets of different types of entities.
As an example, you could start with a set of architects, then filter down to all modern architects, plot them on a map, a timeline etc. – quite nice already, but traditional facet browsing in principle. The catch however, is that you can explore related collections, like the buildings they designed,
their birth places etc. in the same manner. Very interesting principle and nicely executed, yet a bit hard to explain.
In this screencast, David explains it himself:
Freebase Parallax: A new way to browse and explore data from David Huynh on Vimeo.
As a side remark: academically, I think the Humboldt paper by Georgi Kobilarov first presented this principle (but they also refer to an earlier prototype of David’s work). Unfortunately it was introduced under the name of pivot browsing, which is sort of reserved already for the quite related, but not identical principle introduced in dogear.
Any ideas for a good name? Sidewards browsing? Entity shift? Or just stick with parallax?
Physical visualization
Automaten–Andreas created a beautiful new project together with Benjamin Maus:
Reflection.

Essentially, the waveforms of a musical piece by Frans de Waard were rendered as a sculpture with a CNC Milling Machine.
This project sort of follows a week in the life, another physical visualization, where a week of location data of the author is mapped in a wooden cartogram.

See#3

More visualization videos! The See#3 conference organized by Scholz&Volkmer took place in Wiesbaden this weekend, and luckily the streams are online. The speaker list includes Dr. Fritz Reusswig, Frank van Ham, Ben Fry, Julien de Smedt, Zachary Lieberman + Bruce Sterling.