Forrester Research: Social Technographics
Just got my hands on the quite fascinating “Social Technographics” study from Forrester Research. They take a close look at the social and demographic structure of the social web population — unlike Technorati’s statistics which mostly focus on raw blog growth numbers and structural features of the blogosphere. The study is based on two surveys including including close to 5000 North-American individuals each.
Interesting facts:
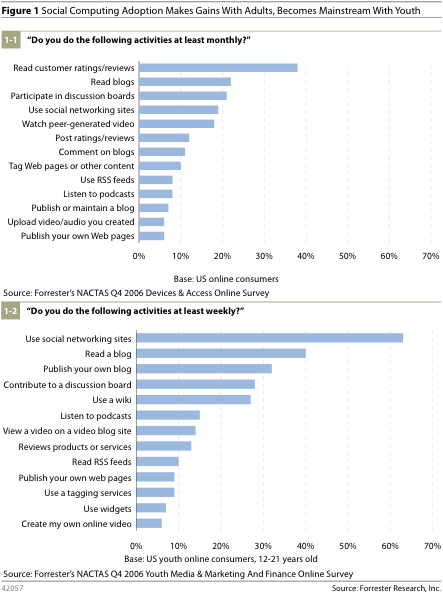
22% of adults now read blogs at least monthly, and 19% are members of a social networking site. Even more amazingly, almost one–third of all youth publish a blog at least weekly, and 41% of youth visit a social networking site daily.
Based on an analysis of online participation and consumption practices, the authors identify six segments of users, ordered by degree of participation:
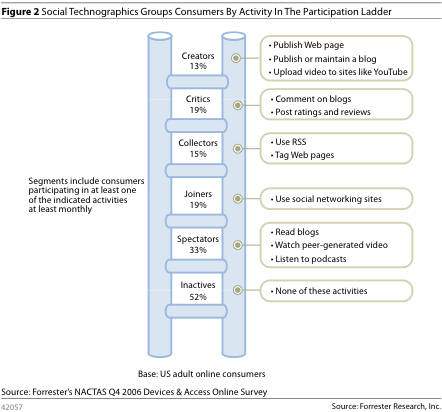
Note that participation at one level may or may not overlap with the participation at other levels — so the ratios sum up to over 100%. I am citing with omissions from the study:
Creators publish blogs, maintain Web pages, or upload videos to sites like YouTube at least once per month. Creators include just 13% of the adult online population. Creators are generally young — the average age of adult users is 39 — but are evenly split between men and women.
Critics participate in either of two ways — commenting on blogs or posting ratings and reviews on sites like Amazon.com. Critics represent 19% of all adult online consumers and on average are several years older than Creators. Two-thirds of them post ratings and reviews, but only 22% comment on blogs and rate/review Web site content. Four out of 10 Critics are Creators as well.
Collectors create metadata that’s shared with the entire community, e.g. by saving URLs on a social bookmarking service like del.icio.us or using RSS feeds on Bloglines. Collectors represent 15% of the adult online population and are the most male-dominated of all the Social Technographics groups. More than two-thirds tag pages, while more than half use RSS.
Joinersuse a social networking site like MySpace.com or Facebook. Joiners represent only 19% of the adult online population and are the youngest of the Social echnographics groups. They are highly likely to engage in other Social Computing activities — 56% also read blogs, while 30% publish blogs.
Spectators represent 33% of the adult online population and are slightly more likely to be women and have the lowest household income of all the social Technographics groups. The most common activity for Spectators is reading blogs, with only a small overlap with users who watch peer-generated video on sites like YouTube. In all, 31% of Spectators do not engage in Creator, Critic, Collector, or Joiner activities.
Inactives. Today, 52% of online adults do not participate at all in social computing activities. These Inactives have an average age of 50, are more likely to be women, and are much less likely to consider themselves leaders or tell their friends about products that interest them.
Finally, the authors discuss demographic features with respect to the segments:
18 – 26 year olds have the highest percentages in almost every participating category. What stands out is the extremely high participation in social network activities (70% for 18–21 year olds!).
More surprisingly, one third of teenagers is also actively creating content, however these are less engaging as Critics or Collectors than other generations.
Generation X is participating with up to 29% for Joiners, but around 40% are merely Spectators or Inactive. Older generations tend to participate less, but still have a Spectator rate of almost one fifth for seniors, which is also more than I expected.
Overall, an extremely interesting study. Aimed at marketers, it also has a lot to offer for designers: What target groups are you designing for — and what incentives will you provide?
Most interesting to me was the pretty even segmentation — I expected an even more skewed distribution with more people passively consuming and only a small percentage actively creating. And good to see that the social web is pretty gender neutral — women even have a slightly higher ratio on social networks activity.
April 27th, 2007 at 10:55 am
Second thoughts: RSS usage is still pretty low (around 10%). And I would like to see the overlap relationships between the segments more clearly. The authors give some numbers, but not a complete overview of how activities are correlated.
April 30th, 2007 at 11:04 am
[…] Moritz Stefaner of Well-formed data shares figures from a Forrester study on Social Technographics: Mapping Participation In Activities Forms The Foundation Of A Social Strategy (link to the Forrester study – link to Stefaner’s digest). […]
May 4th, 2007 at 10:26 am
For the sake of completeness and to point you to ongoing discussions:
At Smart Mobs, there is an interesting discussion going on about the difference between contributing users and page visits with the intention of contribution:
http://www.smartmobs.com/archive/2007/04/27/whos_really_par….html
It got started by a post about a Time article stating that
” According to Hitwise, only 0.2% of visits to YouTube are users uploading a video, 0.05% visits to Google Video include uploaded videos and 0.16% of Flickr visits are people posting photos. Only the social encyclopedia Wikipedia shows a significant amount of participation, with 4.56% of visits to the site resulting in content editing.”
http://www.time.com/time/business/article/0,8599,1614751,00.html?xid=rss-business
If you read the article, you will see that the argument seems at least incomplete or possibly flawed, since the authors constantly mix up “users” and “visits”, and never make clear, what a healthy relation of contribution and consumption should be like and for what reasons. If you think about the effort going into creating a video, I think the ratio of 500 visits to 1 created content is pretty high. Also, what would a ratio of 1:1 mean? One visit on average per created content! Would that be a better sign?
And thanks to KonzeptioNerd for pointing out Nielsen’s view:
http://www.useit.com/alertbox/participation_inequality.html
which points in the same direction as the Forrester study, but I prefer the latter one due to its more differentiated view on “participation”.
May 4th, 2007 at 10:45 am
More good discussion at:
http://www.micropersuasion.com/2007/04/forresters_part.html#comments
May 8th, 2007 at 1:25 am
[…] Is Really Using Web 2.0? Published May 7th, 2007 Society and Culture , Web 2.0 Well-Formed Data and SmartMobs recently reported on the state of Web 2.0 and who is really using it. Based on data […]
May 11th, 2007 at 8:13 am
Really interesting, but I didn’t understand if “consulting wikipedia” was just not considered in the study (maybe because it’s too popular) or if it’s included in the topic “using a wiki” – and in this case it’s funny that the number of adults that consult wikipedia is considered insignificant…
humm…
February 20th, 2008 at 7:00 pm
[…] informatie over het rapport vind je onder meer op Vue Royale, Well-formed data en uiteraard op Forrester’s Groundswell (Charlene […]
March 9th, 2010 at 1:14 pm
[…] Well-formed data – Forrester Research: Social Technographics Share Beteendevetenskap, Statistik, Webbtrender forrester Sommarlöften Google på […]
March 24th, 2011 at 4:29 pm
[…] du contenu original. Ces créateurs ont un profil particulier. On sait qu’ils sont en majorité assez jeunes. On peut présumer également que plusieurs d’entre eux sont adeptes, ou du moins se […]
July 31st, 2011 at 11:01 pm
[…] forrester well-formed-data.net […]
August 25th, 2011 at 9:38 pm
Admiring the hard work you put into your site and detailed information you offer. It’s nice to come across a blog every once in a while that isn’t the same out of date rehashed information. Fantastic read! I’ve bookmarked your site and I’m adding your RSS feeds to my Google account.
December 1st, 2011 at 6:18 pm
Linking Website…
[…]I just read your site that it was very nice.[…]…
May 15th, 2012 at 6:10 pm
Normally I do not read article on blogs, but I wish to say that this write-up very pressured me to take a look at and do so! Your writing style has been surprised me. Thanks, very great post.
August 15th, 2014 at 11:43 am
[…] discussies starten op fora etc. Heel recent onderzoek kan ik niet vinden, het beste komt van Forresters.Op basis van een analyse van online participatie, hebben de auteurs zes segmenten weten te […]