Look ma, no flash!
We reworked the OECD Better Life index. Besides a general facelift and interface overhaul (top work by Raureif, as usual), more languages (Spanish and Russian), the biggest change has been to replace the Flash-based interactive visualization with an HTML5 based component. Big congratulations to Dominikus Baur for the feat of accomplishing something very close to the Flash original (and in some parts even better)!
Dominikus has a super-useful in depth write-up of all the many little tricks that went into optimizing the graphics over on his blog, so I’ll shut up now and let the dirty rectangles do the talking.
Global Agenda Survey 2011
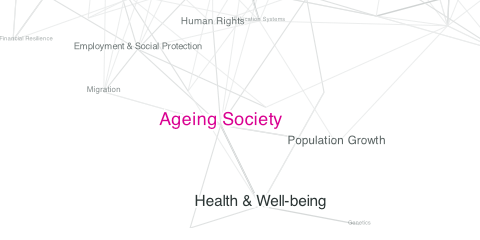
Old news for you, if you follow me on twitter already (or read infosthetics), but here is a quick pointer to the interactive graphics for the Global Agenda Survey 2011 we launched last week for the World Economic Forum:
I realized the project together with the talented Jan Willem Tulp, from who you surely will hear much more over the next few months.
A little technical note: The interactive graphics were all done in HTML5, with the help of the following great Javascript frameworks: raphael.js, underscore.js, d3.js. Except for the network visualization, all graphics run fully interactive down to IE6. #techachievement #lookma #noflash

