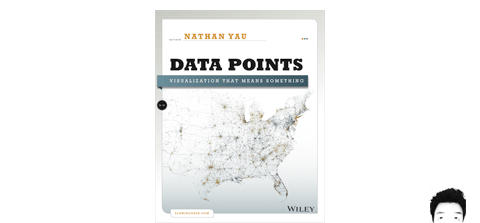
Interview for Nathan Yau’s new book “Data Points”

Nathan Yau‘s new book “Data Points” is out, and while I am still waiting for a copy, here is already a short contribution I made – a few paragraphs of bla:
Nathan Yau: With client work, you must hear “innovative”, “compelling”, and
“engaging” often. Personally, I get a lot of this, and potential clients often don’t have data to work with. What makes a project interesting to you and worth your time?
Moritz Stefaner: In hindsight, the most satisfying projects for me were the ones, where the client or project partners were able to follow me in exploring, questioning, and extending the original data basis and project, sometimes going far away from the original project idea. Some ideas sound really good in the beginning, but turn out bland or much too complicated once executed with real data. Other ideas sound boring beforehand, but become exciting in a specific context. And other ideas you just develop by getting inspired from the data material itself. So, I realize this approach is a lot about trust and also flexibility on side of the client, but is the only way to get your visualization on point, ultimately.
NY: For people like us, the data is interesting as a CSV file, but most
don’t get that luxury. What role does aesthetics play in making data
interesting to a wider audience? What about truth? (You are after all,
the truth and beauty operator :).
MS: I honestly hope, and sometimes think, that the playfulness and organic nature of some of my visualizations does actually get people excited about a topic they would not have been interested in beforehand. I do like to dig in data and be a little “data detective” myself, and if my work can contribute to getting more people excited about querying and questioning data, and, most importantly, come up with new questions to ask, than I am happy :) Aesthetics and appeal are of course a big part of the equation here, besides, of course, relevance of the information presented and truthfulness of the representation. But to me, aesthetics is very little about “decoration” – in my world, a clearly pronounced, rigorous, characteristic, “on point” representation of data lets the inner beauty of a compelling data set shine, instead of trying to “sex up” bland lists of facts.
NY: When getting started with visualization, everyone seems to want to know
the “rules” of turning data into geometry. Are there any rules?
MS: There are no hard rules, but, as in any skill-based profession, there are some things that work better than others, and as for any cultural activity, you are not acting in the void, but in an established set of conventions, expectations and common knowledge. In my experience, great works are not strictly adhering to “the rules”, but, at the same time, are very sensitive to these two types of contexts, and are able to refer to, and sometimes even play with them.
NY: What’s the first thing you do when you have your data and get started on
a project?
MS: Get a coffee, put on a DJ set, fire up Tableau and or Gephi, and Sublime Text for Python and data massaging and plot the sh*t out of the data. Then inspect, take a day to do something else, and follow up on the interesting perspectives. To continue, I might transform the existing data, get some new data, or take one of the interesting, but still very generic views and start to tailor it more to the specific issue at hand.
—
Looking forward to having a copy of the book in my hands! And thanks, Nathan!
—
Btw, a few weeks ago, iCharts interviewed me, too. Good times!