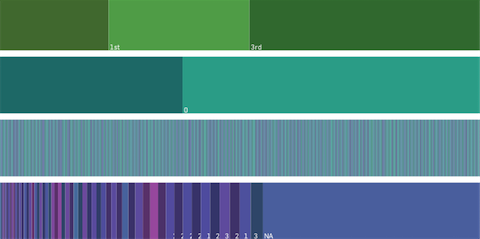
dbcounter – quick visual database stats

At the moment, I am digging through a couple of databases for an upcoming project. I did not really find a tool to quickly get an overview over a large set of categorical data. So I decided to roll my own and write a little nodebox script that walks over a CSV file, determines all the unique value attributes, counts how often they occur and plots the output as an area chart. The tool is good for getting a quick overview of categorical data, esp. missing values and the data diversity.
Download the dbcounter script including a sample data set of the Titanic passengers.
(needs nodebox – OS X only)
On a related note, you can also use the freshly released Parallel Sets application by Robert Kosara to determine relationships between the attributes. But that’s step 2 :)
On another related note, I cannot stress enough how awesome python is.
July 10th, 2009 at 1:23 pm
[…] dbcounter – quick visual database stats I’m putting this info in my things to remember pile. […]
September 14th, 2009 at 9:01 am
An alternative to Nodebox exists for Windows and Linux users, it is called shoebot and is compatible with Nodebox API:
http://tinkerhouse.net/shoebot/
October 31st, 2013 at 11:14 pm
[…] a visual overview of large sets of categorical data (like survey data). I downloaded Nodebox and the script (which is written in Python), and tweaked it a bit. I saved the resulting illustration as a PDF, […]
November 22nd, 2013 at 1:57 pm
[…] After trying a range of different applications, I found a script written by Moritz Stefaner called dbcounter. The script is made for Nodebox, a free Mac application for creating 2D visuals using the Python […]