Better Life Index: 2014 update
The OECD Better Life Index is one of the more popular projects in my portfolio, and now, entering its fourth year, it is still going strong, and is actively developed further. After adding gender and social inequalities, refining the sharing functionality and transitioning over from Flash to HTML5 in the years before, this year’s update is especially interesting: We are closing the loop by visualizing the responses from people all over the world using the site and sharing their Better Life Index with others.
Thanks again to my incomparable and invaluable collaborators Dominikus Baur as well as Timm Kekeritz and Frank Rausch from Raureif without whom none of this would have been possible.
Here’s a few of the new features and details:

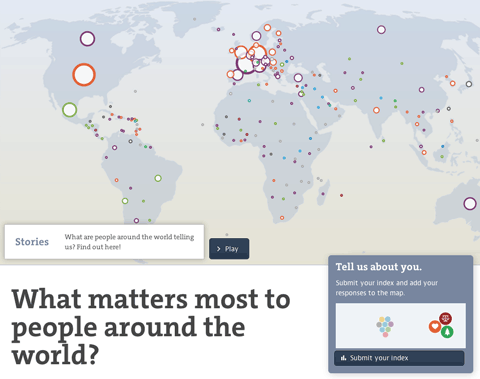
The map initially shows the number of responses per country and gives a hint at the most favored topic per country. You can also switch to equal dot sizes, which highlights the favorite topic distribution across the world, which I found a quite interesting angle on the data.

Zooming in on a country, you can learn about the gender and age distributions, and the topic ranking per country (based on the indexes submitted). You can even compare to other countries or the average response.
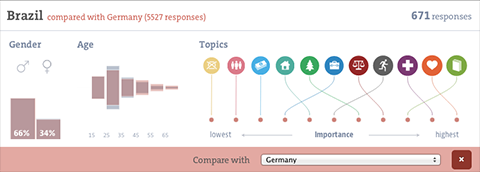
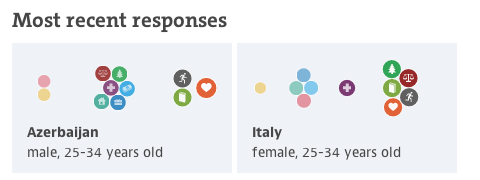
I had fun developing the force directed bubble behavior for the ranking visualizations, it is also used for the miniature visualizations of the submitted indexes and we plan to make it a core component of the Better Life Index toolbox. I would like to say thanks to Gregor for the original inspiration!
Also, on the details front — note how gracefully the visualization deals with identical values — they are all stacked neatly on top of each other, as they should have the same position in the ranking.
Last, there is a soft editorial touch with a “guided tour” through some of the most interesting facts to discover in the visualization, taking you for a quick tour around the world. I hear storytelling with big data is the next big thing, so we just wanted to hop on the bandwagon there :D. On a more serious note, these quick highlights can be an excellent way into a complex visualization and I will definitely explore these types of narrative techniques further in the future.

Anyways, I am really happy how the update turned out, and am especially looking forward to a whole new, but related site for the OECD we are launching soon! Stay tuned!
May 10th, 2014 at 7:18 pm
[…] to name a few. And we do have to mention in this introduction the OECD Better Life Index update, described in detail by Moritz Stefaner, the new additions to Periscopic’ gallery of projects, and the outstanding new visualization […]
January 19th, 2015 at 12:54 pm
[…] to name a few. And we do have to mention in this introduction the OECD Better Life Index update, described in detail by Moritz Stefaner, the new additions to Periscopic’ gallery of projects, and the outstanding new visualization […]