Workshoppin’
Hey all,
I’ll give a (German language) workshop on data visualization together with Dominikus Baur in Munich on May 16 and 17.
The workshop is split in two days, with day one discussing the concept and design aspects of data visualization, while day two goes into the nitty gritty of building a data-based graphic from scratch.

I teach only occasionally, so this is a rare opportunity. I can only recommend to register as soon as possible :)
Also, a good opportunity to talk a bit about the last workshop Dominikus and I gave at resonate. It was a great group, and I was really impressed what the participants came up with in very short time. We worked with a dataset about movies and TV series from IMDb and after a day of basic introduction, the participants went from initial questions and concept over data explorations to visual refinement and annotation in what was basically a day of workshop time.

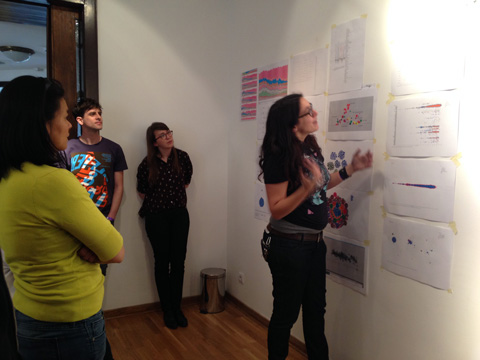

Tableau and RAW proved to be extremely valuable tools. It is amazing what you can achieve in really short time with these applications. The workshop was a big success, and a really nice experience, which also showed in the evaluation results.
Anyways, do consider signing up for the Munich event! And of course, please feel free to ask any questiony by email.
“Weltbilder” master course
This semester, I taught a master course on information visualization at HfK Bremen. It was quite fun and I think I was able improve a bit on the teaching side compared to the first full course I taught two years ago.
The topic was “Weltbilder” – “World views” which has become sort of a theme for my work lately. Here are the introductory slides and reference projects:
The course took place on 8 full days over the course of four weeks in February and March 2013. Overall, I had more than 20 students in the course (although some were only listening in without handing in a final project). The first few sessions were partly filled with me teaching basic craftmanship (slides—30MB) and establishing context, while the students gave presentations on some of my favorite scientific papers and articles (dropbox) and practitioners (such as Nathalie Miebach, Stefanie Posavec, Density Design, Santiago Ortiz, Nicholas Felton, Periscopic, Stamen, Ben Fry, Martin Wattenberg & Fernanda Viegas and the NYT graphics desk). We also had a few practical exercises on drawing family trees and fixing broken charts.
The second half of the course was much concerned with the student’s projects, and I did mostly 1:1 consultations. You can find a few of the final projects here. I like how the course results reflect the diversity of the students themselves – we had artists, computer scientists, journalists, people from humanities – quite a mixed bunch. Overall, I am quite happy with how things worked out and hope I could excite a few of my students to keep doing things in this field :)
Here are two of my favorite projects:
but in sum, they were all pretty nice in one way or the other :) Here’s the gallery