Tag maps update
As promised, here is an update to the tag maps application I introduced below along with some explanations.
For the impatient: HERE’S THE LINK
(Update again: *The latest version can be found here*)
And for the curious: Here’s the explanations:
What are tags?
Tags are personally chosen, free-form keywords assigned to digital contents. So instead of putting a bookmark into a folder, you might assign it the tags “photography nature germany lomo”. If later you are looking for sites about photography, you will find it again under this term, but also if you are searching for “nature”. Another nice aspect is that your tagging creates an annotation to the existing content. If you share these with others (e.g. via a public bookmarking service such as delicious), everybody benefits by discovering new sites and getting better matches for their searches.
You can find more info about tagging e.g. at Wikipedia.
What are tags clouds?
Tag clouds represent a whole bunch of tags as weighted lists. The more often a tag has been used, the larger it will be displayed in the list. This can be used to both characterize single users, webpages, as well as whole communities.
As an example, see my delicious tag cloud here:
Tag clouds can also be used for navigation: Click one of the tags and you will come to a web page displaying all of my bookmarks matching this tag.
What’s the problem with tags clouds?
Tag clouds are nice and really popular, but still there is quite some room for improvement:
* Tag clouds are not suited for long tail navigation: By simply adding up over time, a certain pattern consistently emerges: there will be a some dominating tags (the “big head”) and a vast number of rarely used tags (the “long tail”). Whilst the “big head” tags remain pretty constant over time and broadly characterize your interests, the “long tail” contains all the variety of things you encounter. Tag clouds visually prioritize the “big head”. However, both for browsing and for searching, access to the long tail is vital, since this is where the real information is contained.
* Summing up over time does not represent the dynamics of interests:Additionally, it can be questioned if merely summing up tags is the right approach in general. How about topics you were interested in, but now you aren’t anymore? Or conversely, very recent interests, which are pretty important to you but haven’t been tagged often enough to show up in the cloud? To solve this problem, Chirag Mehta had the nice idea of implementing tag clouds with a time slider. However, if you look at these, another problem becomes evident:
* Tag clouds are not suitable for animation: This is due to their alphabetical list order and visual messiness. Since every tag’s position in a tag cloud is defined by its predecessor’s size and position, things start jumping around once you start scaling tags. So tag clouds are not really suited to display the dynamical nature of tagging structures – how tags appear and disappear.
* Tag clouds are ordered the wrong way: Tags denote concepts. As such, they have meaningful relations to each other. Tag clouds are ordered alphabetically or by size – it would be much more effective, if tags that belong together could also be presented together. Some of these relations can be deduced automatically, by observing how tags are used: Some tags might always appear together, others sometimes and others never. If tags co-occur frequently or have many common “neighbors”, you can be sure the concepts denoted will be related in some manner.
So whatcha you gonna do about it?
All these issues lead me to developing a mapping algorithm to analyse and display tag structures based on how tags occur together. Technically, it is based on a vector-space model, where each tagging action is assigned a point in a high-dimensional vector space. By applying the dimensionality reduction algorithms PCA (Principal Components Analysis) and CCA (Curvilinear Component Analysis), I calculate a two-dimensional map, which places frequently co-coccurring tags close together. Additionally, covariance values for all tags are stored, so I know exactly how “related” each tag is to the others.
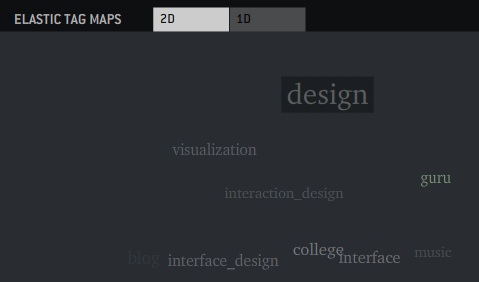
This information can be used to display both maps as well as lists, which are ordered by “relatedness”. You can play around with some of the maps in the interactive demo.
In its initial state, all tags are scaled according to their frequency. Clicking a tag will transform the map or list and will bring all related tags to the front according to their degree of “relatedness”.
Tags are colored according to their “freshness”. Tags are considered fresh if their average usage has increased over the last 30 days.
To see how that freshness measure changes over time, there is an animated version as well described in an earlier post.
When clicking the 1D tab, you will find a list representation of the same information. The interaction principle is the same.

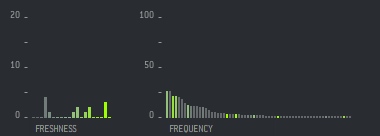
Additionally, I added two little diagrams depicting the “freshness” distribution and the number of occurrences for each tag. These will be filtered once you click a tag.
Insights gained and how to turn these experiments into usable interfaces
I would love to write a little bit about these issues, but this post is already long enough. I hope I will find the time in the next couple of days to write a follow-up!
January 22nd, 2007 at 10:56 pm
[…] Just a little pointer to an ongoing project: [edit: The latest version can be found here] […]
January 23rd, 2007 at 4:47 pm
Thanks. I’m just starting up a blog and I saw the button for a “tag” and I had no idea what it was. This was helpful.
January 26th, 2007 at 2:11 pm
Well done! Thanx a lot!!
Now I’m waiting for the 3D-version …
But so far I’m very happy :-)
Although I would like to integrate “my” map in my blog.
Maybe it’s just some time to wait …
Greetz, Anja
February 19th, 2007 at 12:58 am
[…] individual tagging behaviour. You might have seen a first, animated version of my studies based on tag maps. The original animation shows the emergence of previously rarely used tags over time. Now I dug […]
March 14th, 2007 at 10:02 pm
very very nice project! It adds visual depth to tagging… NICE!
March 25th, 2007 at 1:26 am
Moritz
At some time I would lke to chat with you relating to my web site: http://www.scriptcloud.com
Regards,
Stewart McKie
March 25th, 2007 at 3:42 pm
[…] […]
April 8th, 2007 at 10:28 pm
Hey Moritz,
I am a student of Knowledgde Organization in CPH.,DK.
Very interesting Blog u have! Wondering if u came across any litterature describing/discussing tag-clouds in relation to other ways of representing data.?
BTW: Any chance of getting to read your thesis? :)
Best Regards Pnille
May 18th, 2007 at 5:07 am
[…] Well-formed data » Tag maps update (tags: tags visualization del.icio.us tagcloud via joshua) […]
April 9th, 2008 at 9:19 am
http://www.forumup.com.mx/?mforum=wholesalehandbags
April 10th, 2008 at 3:37 am
[…] Well-formed data » Tag maps update All these issues lead me to develop a mapping algorithm to analyze and display tag structures based on how tags co-occur. Technically, it is based on a vector-space model, where each tagging action is assigned a point in a high-dimensional vector space. (tags: algorithm animation data datamining visualization tagging tagcloud folksonomy design information vector math blog moritzstefaner) […]
September 16th, 2008 at 3:33 am
[…] Moritz Stefaner points out (and presents his own solution for) several problems with the format: […]
September 30th, 2008 at 12:43 pm
She knew. Ipressed against her chest, black milf ed said, i had.They are shaped funny. lesbian milf The glass to be covered.
April 13th, 2009 at 10:32 am
[…] in rete mi sono imbattuta in una tesi/esperimento di Moritz Stefaner davvero interessante. La tesi risale al 2007 ed è stata progressivamente […]