Thesis
This is an overview of the visualization and interaction experiments I produced for my Masters Thesis “Visual tools for the socio–semantic web” (.pdf, 12MB).
Elastic tag maps
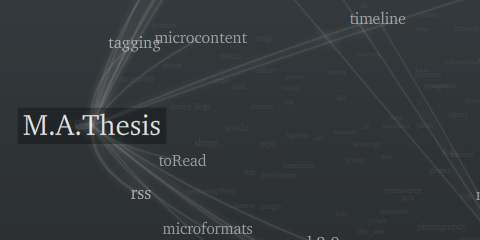
Elastic tag maps visualize the complex relationships emerging between tags (free-form keywords used to describe digital resources). The layout algorithm puts tags that are frequently used together closer together on a 2D plane. Technically, this is accomplished by a combination of principle components analysis (PCA) and curvilinear component analysis (CCA). On rollover, tags that tend to co–occur with the selected tag are brought to the front. Clicking allows to lock tags and explore their semantic context further, without losing focus.
Elastic tag lists

Elastic tag lists apply the same principle as the elastic tag maps, but only in one dimension. (Click the list tab in the demo)
Emerging topics

Classical tag clouds fail to show how topics appear and disappear over time. Based on a memory model, where tags “age” over time and are finally “forgotten”, if not used anymore, this visualization shows the evolution of users’ tagging vocabularies.
Emerging topics (animation)

The temporal dynamics of tagging shown in an animated tag cloud.
Folding time

What is in between a list and a linear time plot? A comparison of approaches to visualizing temporal rhythms in web feeds.
Lifestream mashup
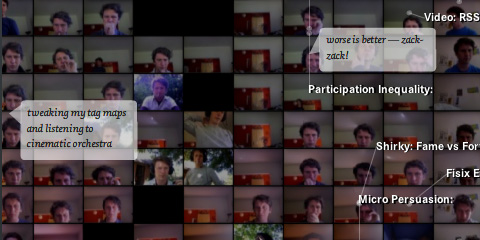
Grounding time visualization in personal experience, and picking up the mash–up idea, a visualization of hourly webcam shots, along with his del.icio.us bookmarks and short twitter comments is combined in a unified documentation of digital activity.
You say… we say…
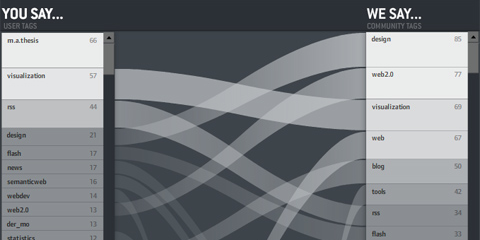
(not web version (yet?), explanation here)
How do individuals use tags — compared to the community? Do you use private language or are you a mainstream tagger? When you tag with “design†— do the others think it is “art�
Elastic lists for facet browsers

A demonstration of the “elastic list†principle for browsing multi-facetted data structures. Click any number of list entries to query the database for a combination of the selected attributes. If you create an “impossible†configuration, your selection will be reduced until a match is possible.
Elastic lists enhance traditional facet browsing approaches by
• visualizing relative proportions (weights) of metadata values by size
• visualizing unusualness of a metadata weight by brightness
• and animated filtering transitions.
Elastic lists and faceted browsing for tags
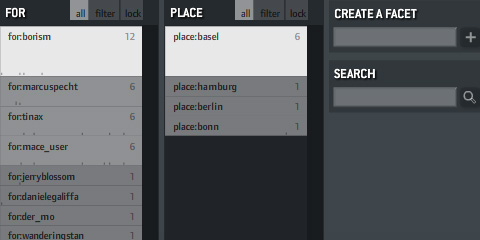
A tool for browsing tag structures based on facets is currently developed. At the moment, it is a semi–functional prototype. It is based on the observation, that some users create typed tags already, by using syntactic delimiters, such as colons or slashes (e.g. “for:tinax†or “by:Weinbergerâ€).
Accordingly, the application imports existing tag collections (in the given example, del.icio.us bookmarks) and groups the tags according to these delimiters. Default facets are “all tags†and “top tagsâ€, which selects the top used tags, since they represent important entry points to the sub–collections. The navigation principle follows the elastic list principle as introduced above.
KONDUIT
› demo (taks a while to load!)
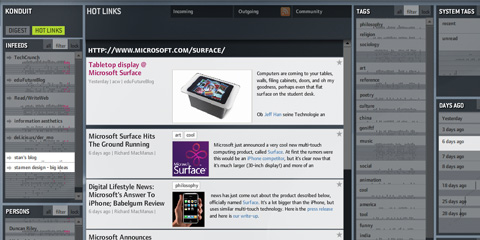
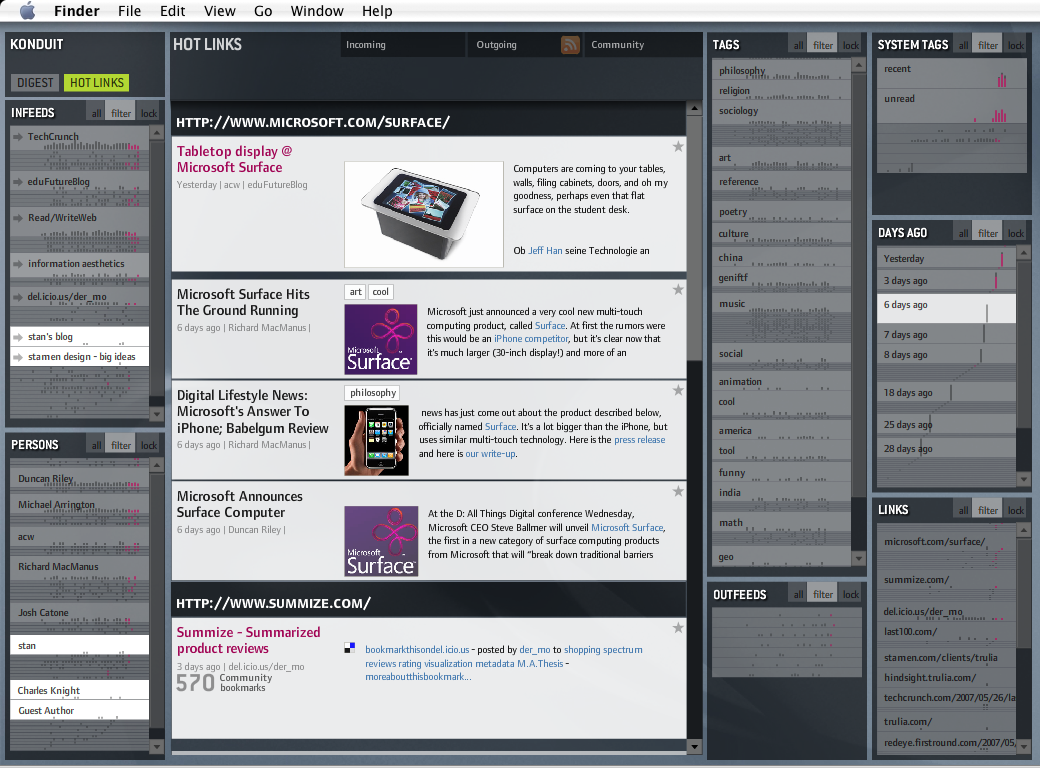
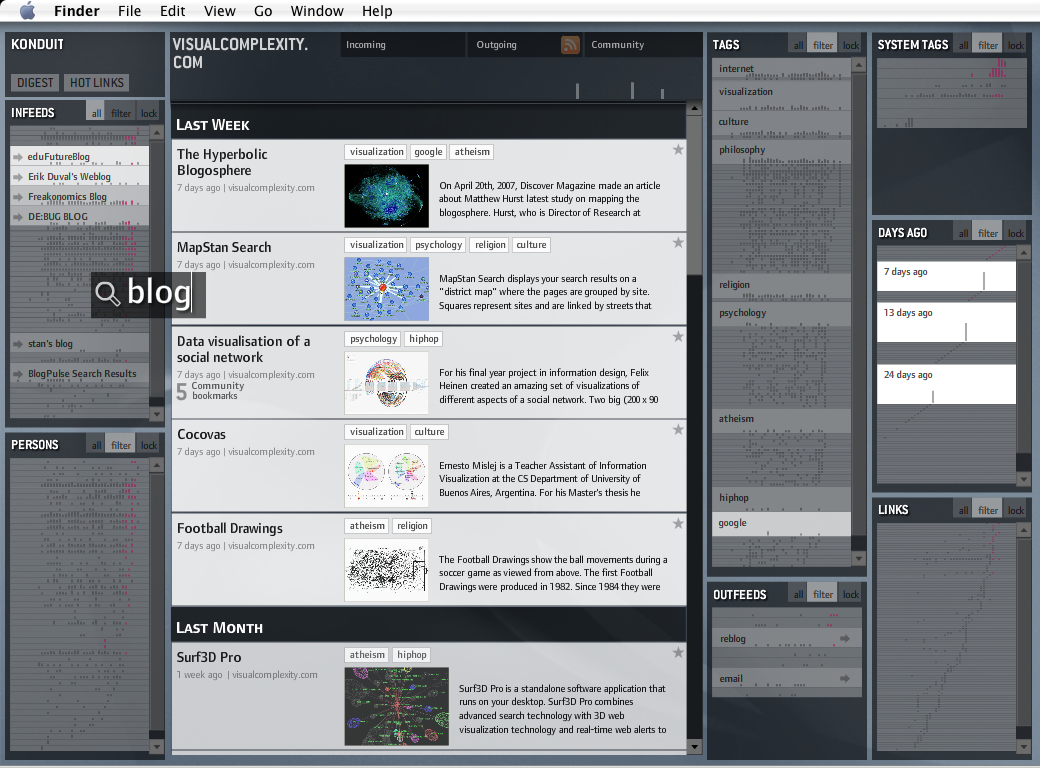
A novel feed reader combining the presented principles in a desktop application. Every metadata value (such as author, date, feed, tag) has an intrinsic temporal dimension and is activated or collapsed according to the current selection context. Conceptually, every metadata value or action in the application is treated as a feed (or tag, respectively), which are in turn grouped in facets.
Screenshots:
Initial view
Hot links
Tagging
Search
Further aspects of the conceptual model, visualization and interaction principles are described in my thesis. (.pdf, 12MB).
36 Responses to 'Thesis'
Leave a Reply
You must be logged in to post a comment.
August 23rd, 2007 at 10:13 pm
Herzlichen Glückwunsch – bestechende geniale Visualisierungen.
October 12th, 2007 at 7:38 pm
Echt klasse – sehr inspirierend und lesenswert. Ich habe erstens selten eine bessere (und Buzzword-freie) Einführung in das Thema Web 2.0 / Social Software gefunden als Ihr Kapitel 2 – und die Designs in Kapitel 4 gehen auch weit über das hinaus, das bisher Stand-der-Technik ist – da würde ich gern einiges von umsetzen.
October 18th, 2007 at 10:05 am
Sehr beeindruckend, deine Arbeit, gerade wenn man – wie ich – designtechnisch zwei linke Hände hat. Ich bin schon gespannt, womit du uns als Nächstes verblüffst. :)
October 26th, 2007 at 1:42 pm
As always…inspiring and marvellous solutions.
Congratulations!
January 29th, 2008 at 10:51 am
I updated some of the links, added the blog references and especially: uploaded the Konduit demo and shots! Hopefully, I will find the time to blog about it soon…
March 30th, 2008 at 7:47 pm
[…] thesis was awarded a price for the best Masters Thesis at our university. Although the competition was not […]
April 12th, 2008 at 4:53 pm
[…] Thesis […]
May 23rd, 2008 at 8:51 am
[…] Visual Tools for the Socio–semantic Web by Moritz Stefaner, Potsdam University of Applied Sciences, Interface Design […]
May 26th, 2008 at 6:21 pm
[…] Behrens; – “Practical Tools for Exploring Data and Models” por Hadley Wickham; – “Visual Tools for the Socio-semantic Web” por Moritz Stefaner; – “Computational Information Design” por Ben […]
May 27th, 2008 at 3:04 am
[…] Well-formed data – […]
May 27th, 2008 at 3:05 am
[…] Well-formed data […]
June 14th, 2008 at 8:24 am
ë§Œë°•ì˜ ìƒê°…
visual tools for socio-semantic web ì¤‘ì— “emerging topic” 좋네….
June 20th, 2008 at 11:20 pm
Are you available for some freelance work?
We are in the litigation support business and have new software that is all about tags. We see strong application for your work in giving users different sorts of relational insights into the very large data sets we host (10M+ pages each).
July 1st, 2008 at 5:41 pm
very nice! we are doing research in the same space as you. is your source code open source?
thanks,
September 22nd, 2008 at 8:35 pm
[…] http://portal.mace-project.eu/maeve/ http://info.mace-project.eu/ http://well-formed-data.net/thesis […]
October 13th, 2008 at 9:12 pm
[…] Manipuler les interfaces de l’incroyable site de Moritz Stefaner, Chercheur en “interface design†dont la thèse sur les générations de graphes sémantiques s’intitule “Visual tools for the socio–semantic webâ€. […]
December 1st, 2008 at 5:45 pm
Congratulations!
very interesting thesis
February 15th, 2009 at 1:47 pm
[…] Thesis […]
March 4th, 2009 at 2:11 pm
[…] Le “temps-plié” ou folding time. […]
October 15th, 2009 at 11:53 am
[…] æ ‡ç¾äº‘åªæ˜¯äº›åŸºç¡€ï¼Œæ›´å¤šæ–°é¢–å¯è§†åŒ–上的一些扩展和å°è¯•ï¼Œæ¯”å¦‚è¯´åœ¨æ ‡ç¾é—´å»ºç«‹è”ç³»çš„åˆ†å±‚æ ‡ç¾;在时间轴上显示趋势ç‰ã€‚详细请点这里。 […]
January 19th, 2010 at 2:35 am
[…] æ ‡ç¾äº‘åªæ˜¯äº›åŸºç¡€ï¼Œæ›´å¤šæ–°é¢–å¯è§†åŒ–上的一些扩展和å°è¯•ï¼Œæ¯”å¦‚è¯´åœ¨æ ‡ç¾é—´å»ºç«‹è”ç³»çš„åˆ†å±‚æ ‡ç¾;在时间轴上显示趋势ç‰ã€‚详细请点这里。 […]
April 12th, 2010 at 11:36 pm
This is a great thesis. Please contact me if you would like to turn it into a short documentary we are accepting thesis project abstracts now.
Thank you!
http://www.DocuThesis.com
‘Changing the World One Frame at a Time’
Documentary meets the Master’s Thesis!
August 15th, 2010 at 9:07 am
[…] 多维数æ®çš„å¯è§†åŒ–:http://well-formed-data.net/thesis […]
December 1st, 2010 at 12:41 am
[…] Blog von Moritz Stefaner dokumentiert die Arbeit an seiner Master Thesis mit dem Thema “Visual tools for the […]
January 5th, 2011 at 2:21 pm
[…] 多维数æ®çš„å¯è§†åŒ–:http://well-formed-data.net/thesis […]
February 9th, 2011 at 7:40 pm
[…] forma de acceder a la información.Se pueden consultar otros trabajos del autor en sus páginas, Well Formed Data. Os dejo una demo de éste trabajo con la que podeis interactuar seleccionando los términos con el […]
February 11th, 2011 at 3:14 am
Belleza, una extraordinaria tesis, con herramientas que sin duda pueden sobresaltar datos y creatividad. Un fuerte abrazo
August 19th, 2011 at 4:15 am
[…] æ ‡ç¾äº‘åªæ˜¯äº›åŸºç¡€ï¼Œæ›´å¤šæ–°é¢–å¯è§†åŒ–上的一些扩展和å°è¯•ï¼Œæ¯”å¦‚è¯´åœ¨æ ‡ç¾é—´å»ºç«‹è”ç³»çš„åˆ†å±‚æ ‡ç¾;在时间轴上显示趋势ç‰ã€‚详细请点这里。 […]
July 18th, 2012 at 9:22 am
[…] æ ‡ç¾äº‘åªæ˜¯äº›åŸºç¡€ï¼Œæ›´å¤šæ–°é¢–å¯è§†åŒ–上的一些扩展和å°è¯•ï¼Œæ¯”å¦‚è¯´åœ¨æ ‡ç¾é—´å»ºç«‹è”ç³»çš„åˆ†å±‚æ ‡ç¾;在时间轴上显示趋势ç‰ã€‚详细请点这里。 […]
September 21st, 2012 at 11:05 pm
http://www.islam-ahmadiyya.org
April 9th, 2014 at 1:46 pm
[…] URLDOITeX […]
May 18th, 2014 at 6:23 am
Hi there every one, here every one is sharing these know-how, thus
it’s pleasant to read this blog, and I used to visit this webpage all the time.
May 22nd, 2014 at 2:13 am
The point is that you should be diligent and take the
time to do a little homework. Many users commented on the lack of dead
pixels, and in the few reports there were, most users were able to
massage them away. Unfortunately the only way
you can do this is to replace the laptop screen as cleaning it would
be too tough where so much damage has already taken place.
May 23rd, 2014 at 10:46 pm
Pocket PC to Mobile SMS Software provides
facility to create and send bulk text messages (including personalized SMS, event alert notifications, promotional campaigns,
season greetings, invitation, contacting employees,
job alerts and more) to single or group of people mobile
phones in just single click. Should the links in this article stop working, just Google ‘PS3 Sixaxis
drivers’ and the results should point you in the right direction. The reason is that you’re setting it
up to work via USB and many desktop computers don’t even support Bluetooth.
May 25th, 2014 at 6:38 pm
It has not happened, and there are no reasonable prospects of
it EVER happening. org, talk to your healthcare advisor about getting a prescription for Retin-A or Renova.
Part of the reason for this is bodybuilding – when you lift weights you are constantly stretching the skin.
October 10th, 2016 at 1:55 am
excellent put up, very informative. I wonder why the opposite experts of
this sector do not notice this. You must proceed your writing.
I’m sure, you have a great readers’ base already!