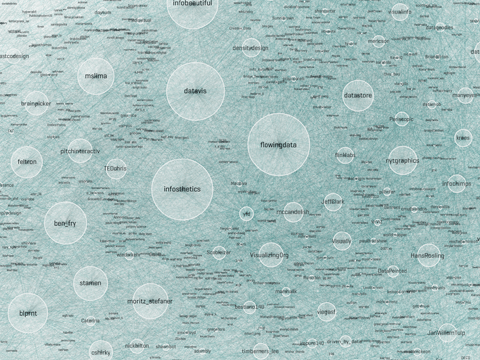
The VIZoSPHERE
A new diversion of mine: mapping twitter accounts related to information visualization with gephi:
This map shows 1645 twitter accounts related to the topic of information visualization. The accounts were determined as follows: For a subjective selection of “seed accountsâ€[1], the twitter API was queried for followers and friends. In order to be included into the map, a user account needed to have at least 5 links (i.e. follow or being followed) to one of these accounts. The size of the network nodes indicates the number of followers within this network.
[1] The seed accounts were; @moritz_stefaner, @datavis, @infosthetics, @wiederkehr, @FILWD,
@janwillemtulp, @visualisingdata, @jcukier, @mccandelish, @flowingdata, @mslima, @blprnt,
@pitchinteractiv, @bestiario140, @eagereyes, @feltron, @stamen, @thewhyaxis
Infovis lecture at HfK Bremen
This semester, I held a lecture on Information Visualization at HfK Bremen. For the final projects, the theme was “mapping you, mapping me”. The idea was to generate data sets of personal relevance, and visualize them adequately. Check out the student projects here:Â http://infovis-hfkb.tumblr.com/
